Skip to content
All calculators

Home Loans

Rent VS Buy Calculator

Decide whether renting or buying a home is more financially beneficial for you. This calculator compares the costs associated with renting to those of buying a home, considering long-term growth in property value.

Live comparison

Compare renting and buying side by side

Adjust the assumptions and see which path leaves you in the stronger position.

Property & loan

Percent of the price
Years
Per year
Per year

Ownership costs

Per year, on the house value

Renting

Usually 4x weekly rent
Rate the renter's savings earn
Years

Description

Compares the estimated net position from buying a home with renting and investing savings over the selected period.

Assumptions

  • Future-dollar estimate only; excludes inflation, tax, property rates, transaction/moving costs, and changes to inputs.
  • House value and ownership costs update yearly. Rent is 52 weeks plus bond in year 1, then grows with the house.
  • The loan is price less deposit, repaid yearly with principal and interest.
  • Both paths are assumed to spend the same each year. The renter invests the deposit, then each year pays rent and invests whatever the buyer spent above it (mortgage, insurance and maintenance). Those savings earn the savings rate and compound for the whole period.

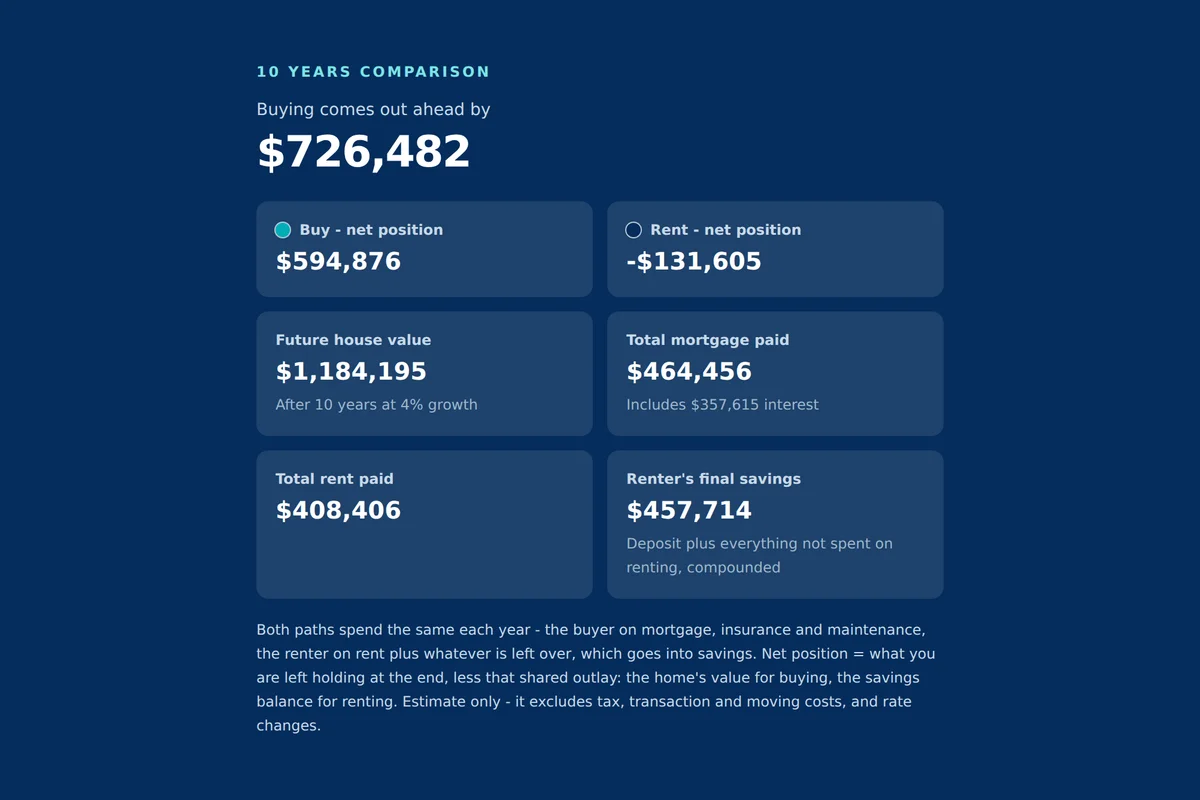
10 years comparison

Buying comes out ahead by

$93,287

Buy - net position

$55,869

Rent - net position

-$37,417

Future house value

$1,075,133

After 10 years at 3% growth

Total mortgage paid

$945,895

Includes $185,895 interest

Total rent paid

$210,043

Renter's final savings

$981,847

Deposit plus everything not spent on renting, compounded

Both paths spend the same each year - the buyer on mortgage, insurance and maintenance, the renter on rent plus whatever is left over, which goes into savings. Net position = what you are left holding at the end, less that shared outlay: the home's value for buying, the savings balance for renting. Estimate only - it excludes tax, transaction and moving costs, and rate changes.

Year-by-year breakdown

10 years
YearHouse valueInsuranceMaintenanceMortgageRentRenter investsRenter's savings
1$824,000$2,400$4,000$94,589$19,600$81,389$122,585
2$848,720$2,472$4,120$94,589$18,746$82,435$208,686
3$874,182$2,546$4,244$94,589$19,308$82,071$296,997
4$900,407$2,623$4,371$94,589$19,888$81,695$387,572
5$927,419$2,701$4,502$94,589$20,484$81,308$480,469
6$955,242$2,782$4,637$94,589$21,099$80,910$575,745
7$983,899$2,866$4,776$94,589$21,732$80,500$673,460
8$1,013,416$2,952$4,919$94,589$22,384$80,077$773,673
9$1,043,819$3,040$5,067$94,589$23,055$79,642$876,448
10$1,075,133$3,131$5,219$94,589$23,747$79,193$981,847

Net position over time

Where each path leaves you at the end of each year across the comparison horizon.

Rent vs Buy projection

Both paths pay the same each year, so the gap is simply the home's value against the renter's savings balance.

Buy - net positionRent - net position
-$50K$213K$475K$738K$1.0M0246810Net positionYears